
Painting 1,300 square miles (about 3,400 square kilometers) of the San Francisco Bay Area reportedly cost about 9 cents per square kilometer once model training was done. That figure comes from the creator’s own comment on Hacker News. Isometric SF is a web map released in November 2026 by American developer Justin Chavez, in which AI paints the entire Bay Area, from the Golden Gate Bridge to San Jose, in a pixel-art-styled look reminiscent of the classic SimCity games. You can view it right away at isometricsf.com, no login required.
Here, “isometric” refers to a view that looks down on a city at a slant. Think of the screens in games like SimCity or RollerCoaster Tycoon.
Why It Spread
It started on Hacker News, the developer community. The introduction posted on the “Show HN” board had collected 256 points and 76 comments as of Nov. 19, 2026. In that post, the creator said the idea came from Isometric NYC, which went viral in January 2026, and on X he also named Tiny London as an inspiration.
A trend was already building behind it. Isometric Cities, a site that collects isometric city maps, listed 132 maps covering 98 cities in 38 countries as of Nov. 19, 2026. For San Francisco alone there are four AI-drawn maps, and two of them are Chavez’s (the North Beach test version in September and this Bay Area version).
According to the sources, the reasons are “scale” and “price.” Painting an entire metropolitan region, not just one neighborhood, without spending much money caught developers’ attention. One more observation from using it: there is real fun in seeing places you know as scenes from a game. The location you are viewing is saved in the address bar, so it is easy to send a friend a single link that says “this is our office.”
How to Use Isometric SF
On your first visit, you see a “LOADING THE BAY” message and wait about 6 seconds before the map opens. The screen has only a search bar at the top, the creator’s credit and a “how it was made” link at the bottom left, and a yellow share button at the bottom right. As you zoom in and out with the mouse wheel, the address updates to include the zoom level and coordinates, so you can share exactly what you are looking at.
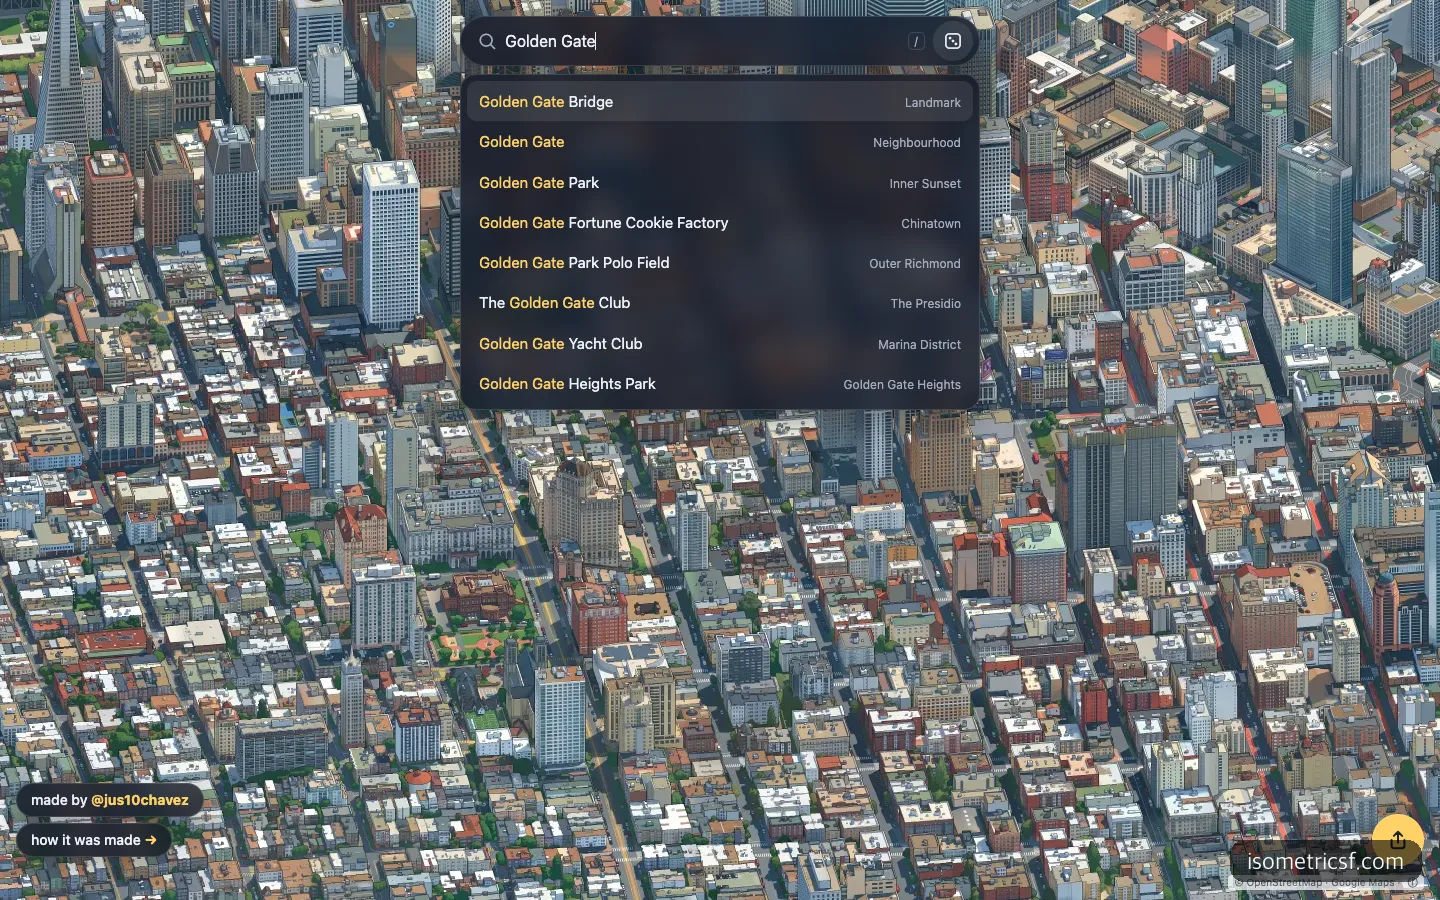
Typing Golden Gate instantly brings up eight places, from the bridge to the park to neighborhood names, each labeled by type.
Search is more useful than you might expect. Typing “Golden Gate” brought up autocomplete results right away, including the Golden Gate Bridge, Golden Gate Park, and even a fortune cookie shop in Chinatown, and clicking the first result flew me to the bridge in under 5 seconds. The site has 25 hand-picked landmarks, including the Golden Gate Bridge, Alcatraz, and Apple Park, and the creator explained that places not on the list can be found by latitude and longitude.
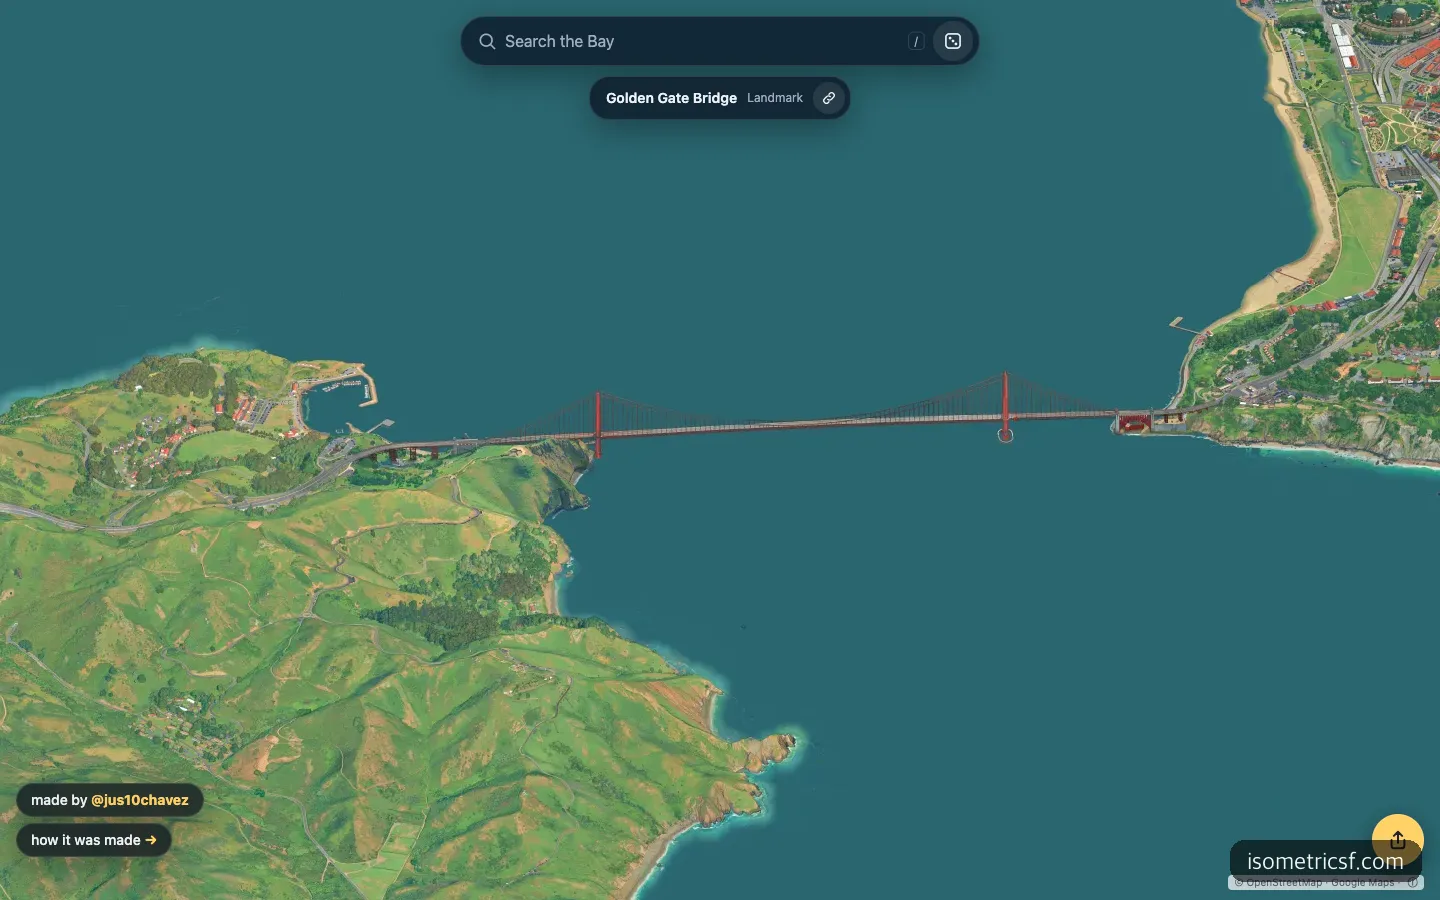
The view after jumping to the Golden Gate Bridge. The hills and bridge have a painted texture, but the water is laid down in almost a single color.
What catches your eye first on the Golden Gate screen is the water. The bridge and hills look brushed on, but the water is a flat teal surface. The technical write-up explains why: the water, which covers about 16% of the map, was not drawn by AI but overlaid separately. In exchange, the shape of the bridge over the water stays clean.
The 9-Cent Secret: Swapping Between Three Models
The price came down because one model did not draw everything. According to the creator’s write-up on how it was made (Nov. 11, 2026), the process goes like this. First, Google’s photorealistic 3D map tiles are loaded with three.js and captured from a 30-degree downward angle facing east. Then three models pass the baton in turn.
| Step | Model used | Role |
|---|---|---|
| 1. Making examples | Nano Banana 2 (Google’s large image model) | Redrew 45 Google renders in a SimCity 3000 style to create style pairs |
| 2. Testing and teacher | Qwen-Image-Edit 2511 (20 billion parameters) + LoRA | Trained on those pairs, then drew 1,460 locations to serve as the answer key for the small model |
| 3. Mass production | FLUX.2 Klein 4B + LoRA | Distilled to draw in 4 steps, and painted the entire map |
LoRA is a method that adds a style by training only a small add-on instead of retraining a large model from scratch. The expensive model was used for only a few dozen examples, and the tens of thousands of actual images were left to a small model. The creator estimated that drawing the whole map with Nano Banana 2 would have cost about $7,000. That is not money actually spent but a comparison estimate.
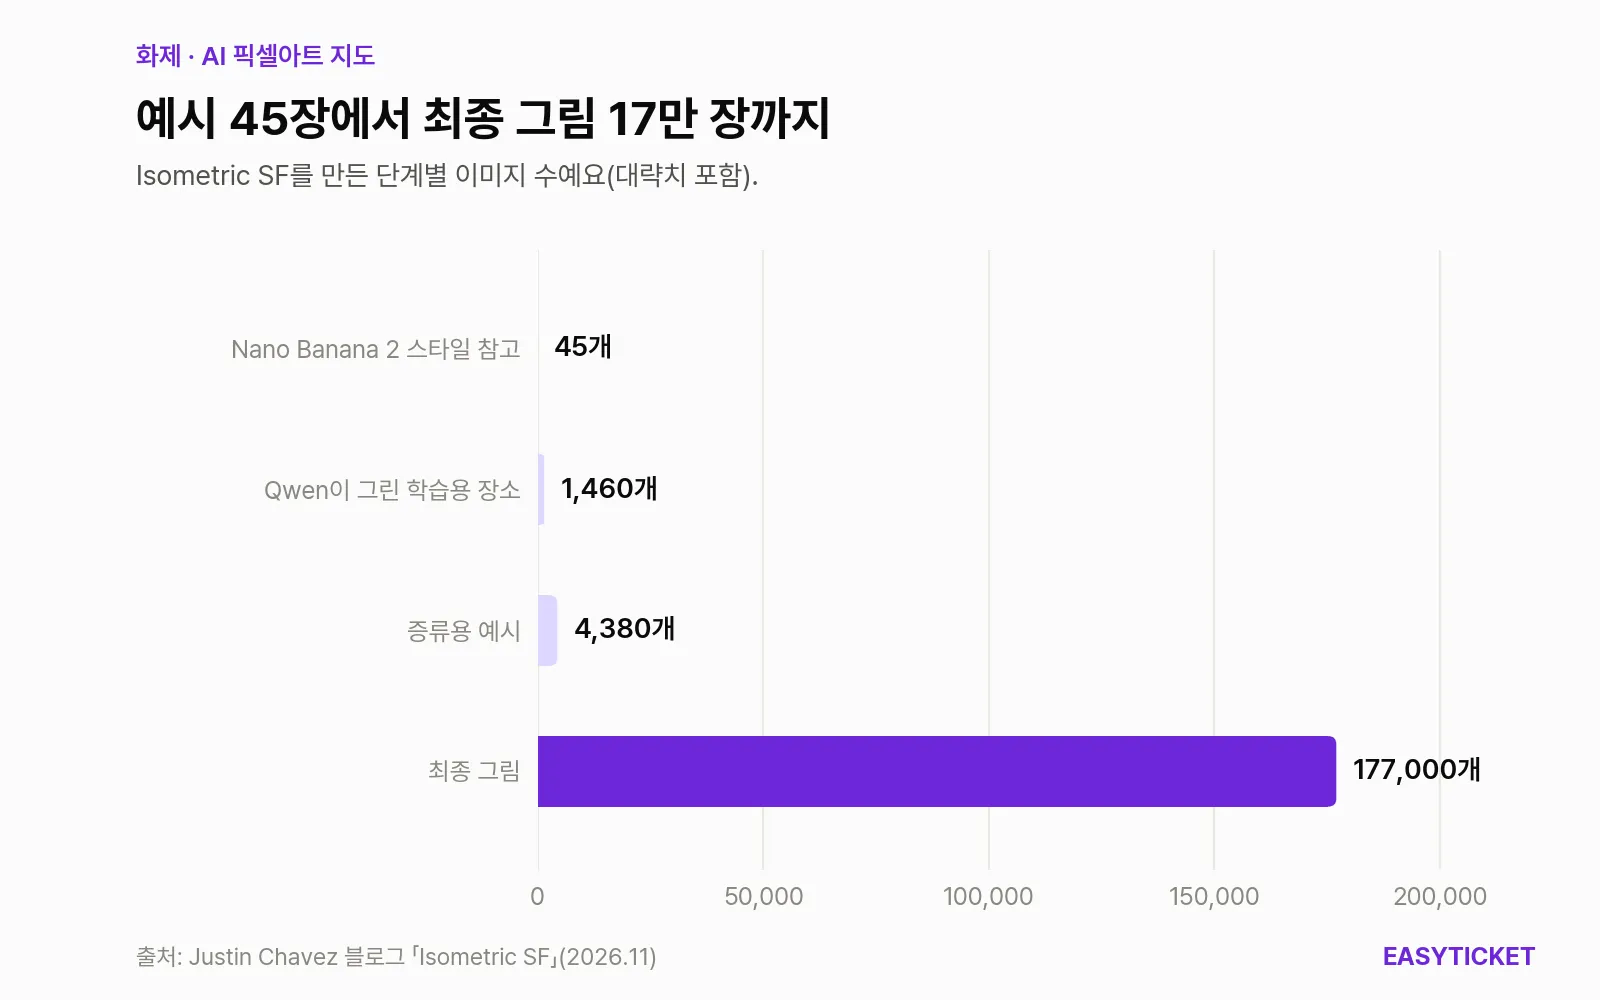
How 45 hand-picked examples grew into about 177,000 final images.
What the chart shows is the ratio. Between the 45 images at the top and the 177,000 at the bottom, there is a difference of nearly 4,000 times. People touched only the top stage, and the rest was a chain in which each model taught the next.
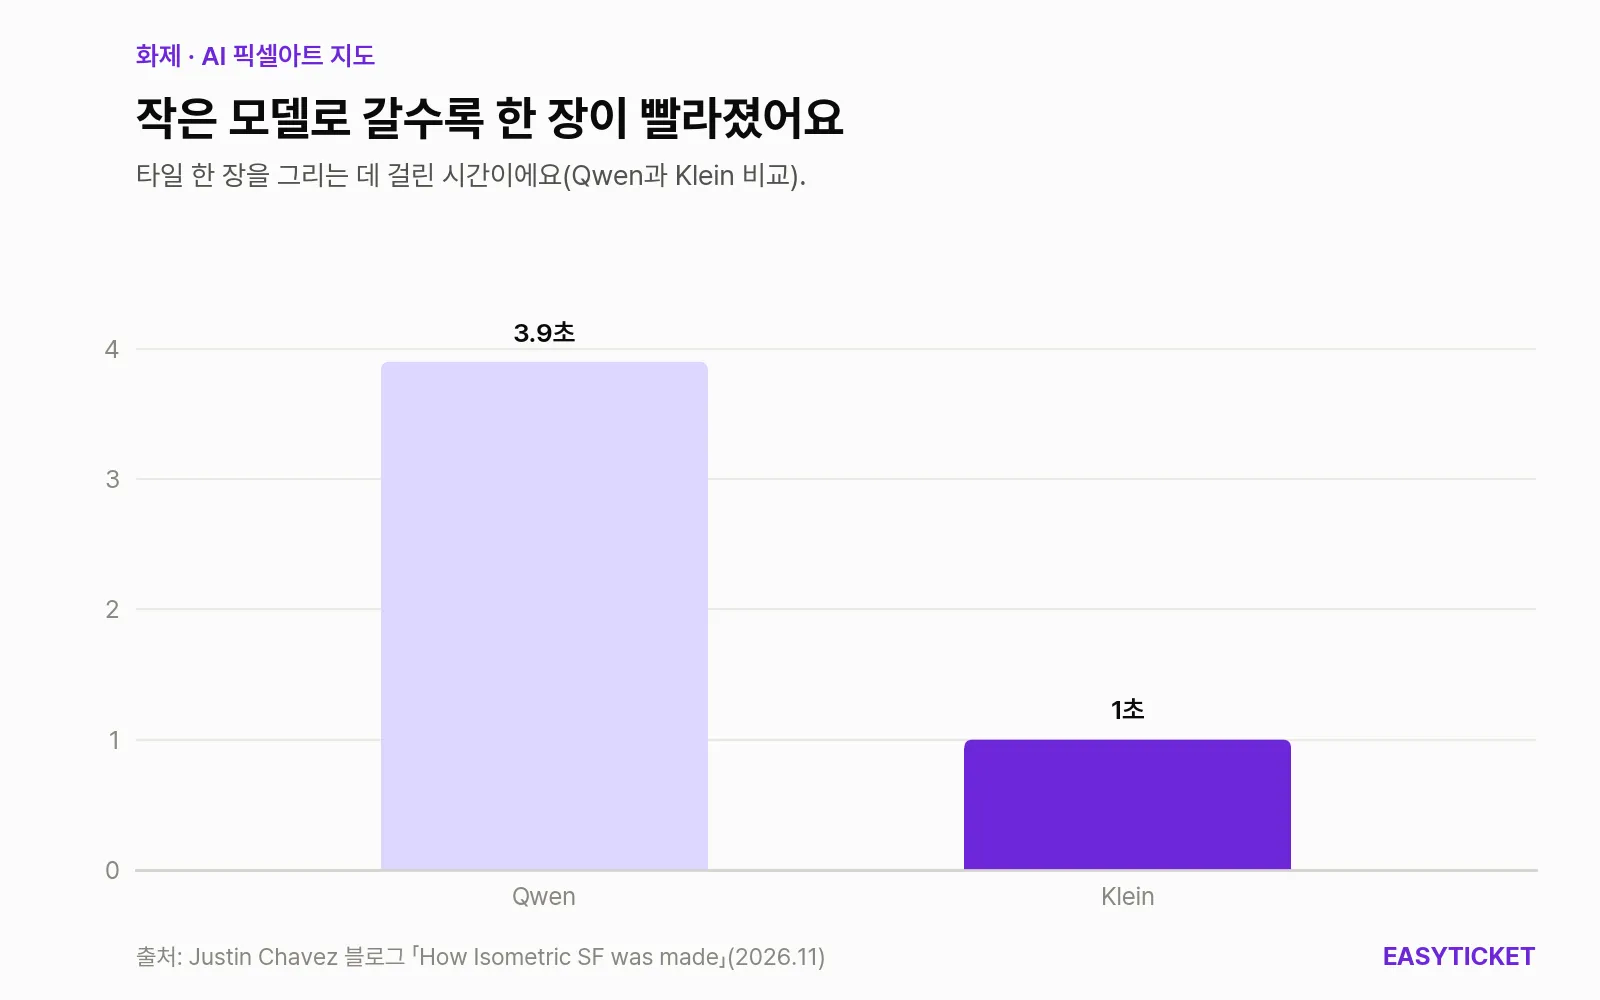
Time per tile for the middle model, Qwen, and the final model, Klein.
Klein is about one-fifth the size of Qwen and took just over 1 second per tile, while Qwen took 3.9 seconds. With 177,000 images to draw, those few seconds translate directly into cost. In total, about 172 H100 GPU hours were used (about 119 of them for generating the map), and LoRA training, revised four times, took under 6 hours altogether. The creator also wrote a separate script that automatically stops the GPU when spending passes a set limit, and the results were stored on a 3TB external drive.
For vibe coding readers, the code side is more interesting. In a retrospective post on Nov. 4, the creator said a coding agent such as Claude Code wrote most of the code, and that the agent even fixed on-screen problems by looking at screenshots itself. His own share, he said, was the idea, handling exceptions such as bridges being drawn as water, and waiting on GPUs and storage.
The “Is It Really Pixel Art?” Debate
Most Hacker News comments leaned toward this question rather than praise: “It’s not real pixel art.” The evidence is specific, too. Commenters pointed to anti-aliasing that softens the edges of lines, the lack of a consistent pixel grid, tile seams that show as overlaps, and the blurring typical of AI around power lines and railroad tracks. That led to a proposal to call it “pixel-art-styled,” along with advice that reducing the number of colors and snapping to a grid would improve it.
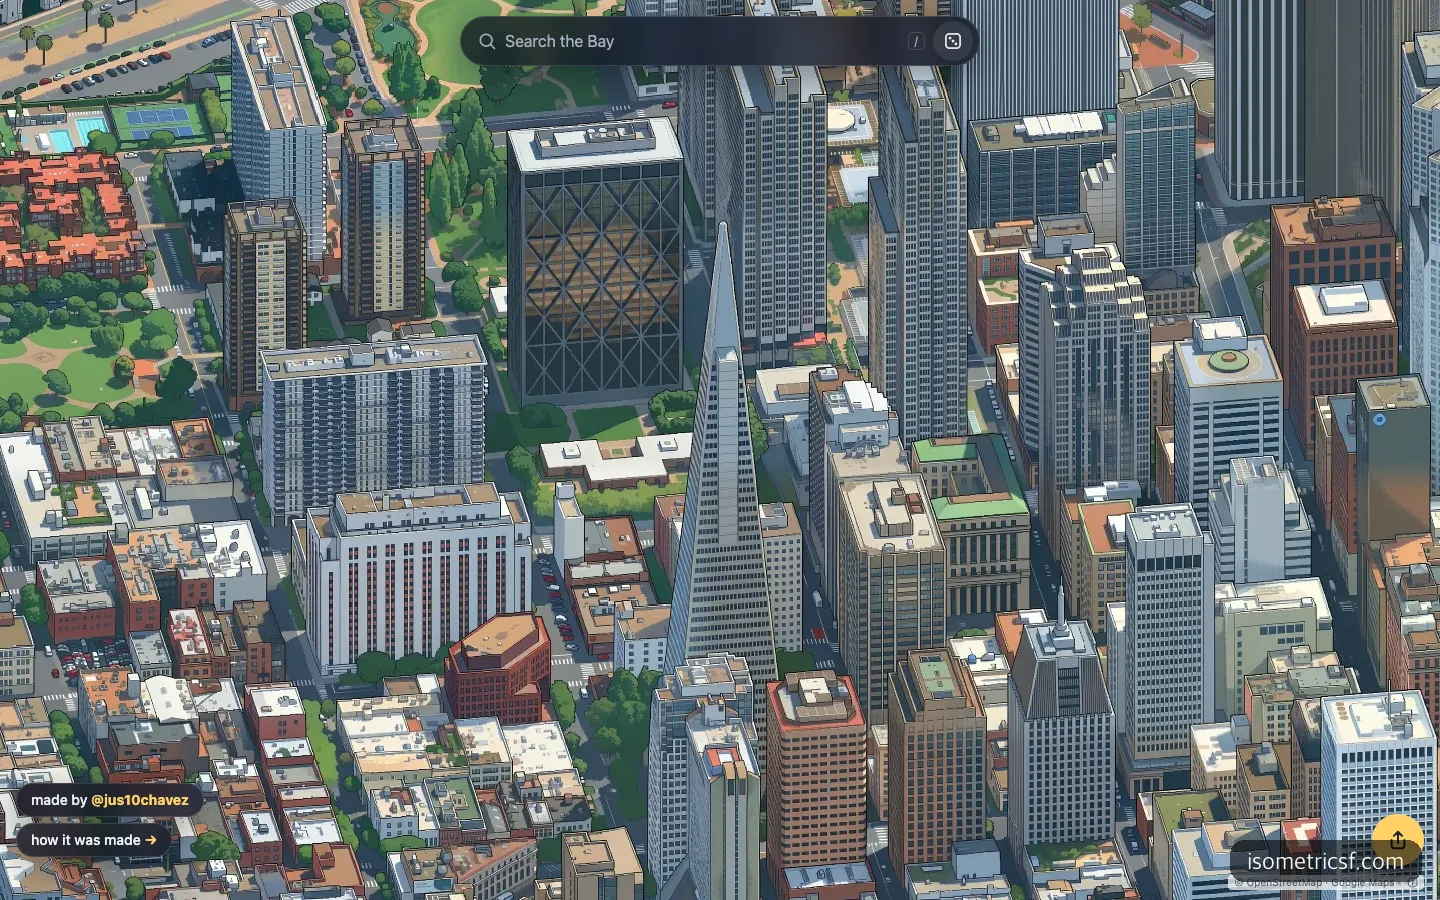
The area around the Transamerica Pyramid on the first screen. Windows and rooftop equipment are crisp, but the lines blur softly.
Zooming in yourself, the criticism makes sense. Glass windows, rooftop equipment, and even street trees are sharp, but the edges are not crisply angled dots; they are soft lines closer to digital illustration. On the other hand, there is clear praise to give. That building shapes and road layouts stay consistent in one style across such a vast area is something that would be hard for a person to do by hand.
The same debate came up for the original. When Isometric NYC was introduced on GeekNews (a Korean tech news community) in January 2026, reactions like “it’s closer to a filter” and “you can tell it’s AI” appeared, and Andy Coenen, who made NYC, accepted that the pixel art criticism was fair. In his own post, he wrote that as content gets easier to make, what makes the difference in the end is the care put into it. EasyTicket thinks that remark will outlast the argument over the name. The model supplies the style, but deciding what to fix and what to keep is still up to people.
The Original NYC, and Another Map of the Same City
Even within the same trend, the results differ quite a bit. Here is how they compare when set side by side with a map that drew San Francisco before the original did.
| Isometric SF | Isometric NYC (the original) | Isopolis San Francisco | |
|---|---|---|---|
| Released | November 2026 | January 2026 | August 2026 |
| Area drawn | 1,300 square miles of the Bay Area | New York City (about 40,000 tiles) | San Francisco |
| Final model | FLUX.2 Klein 4B + LoRA | Fine-tuned Qwen Image Edit | Fine-tuned Qwen Image Edit 2511 |
| Look and feel | Bright and cheerful, minimal on-screen extras | Dark and calm, strong pixel feel | Game-like, with tours, radio, and place collecting |
| Best for | People who want to browse widely and search | People who want to enjoy the SimCity texture itself | People who want to follow the city’s stories |
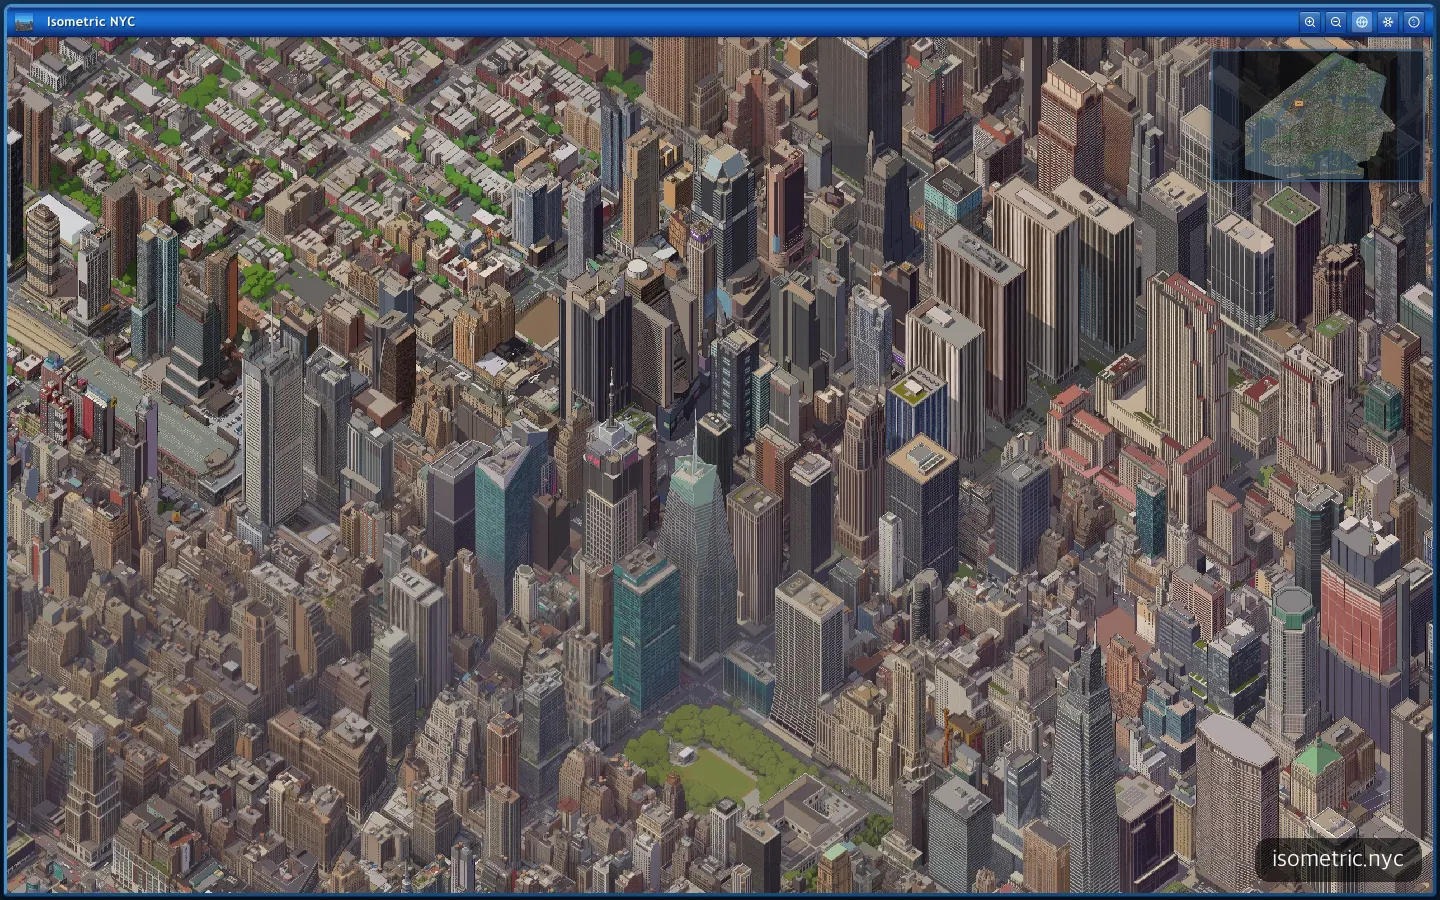
The original Isometric NYC. The screen looks like an old Windows window frame, with calmer colors and a stronger pixel feel.
The original NYC adds a minimap and zoom buttons in an old-Windows-style window frame for more of a game feel. Its colors are also dark and calm, so it is closer to the word “SimCity” than the SF version. Coenen said he fine-tuned the model with about 40 example pairs, spending about 4 hours and roughly $12, and skipped Nano Banana for the nearly 40,000 tiles because it was too slow and expensive. The idea of teaching a big model’s work to a small one and running it in bulk is the same as in the SF version, which adds one more step and goes down to an even smaller model.
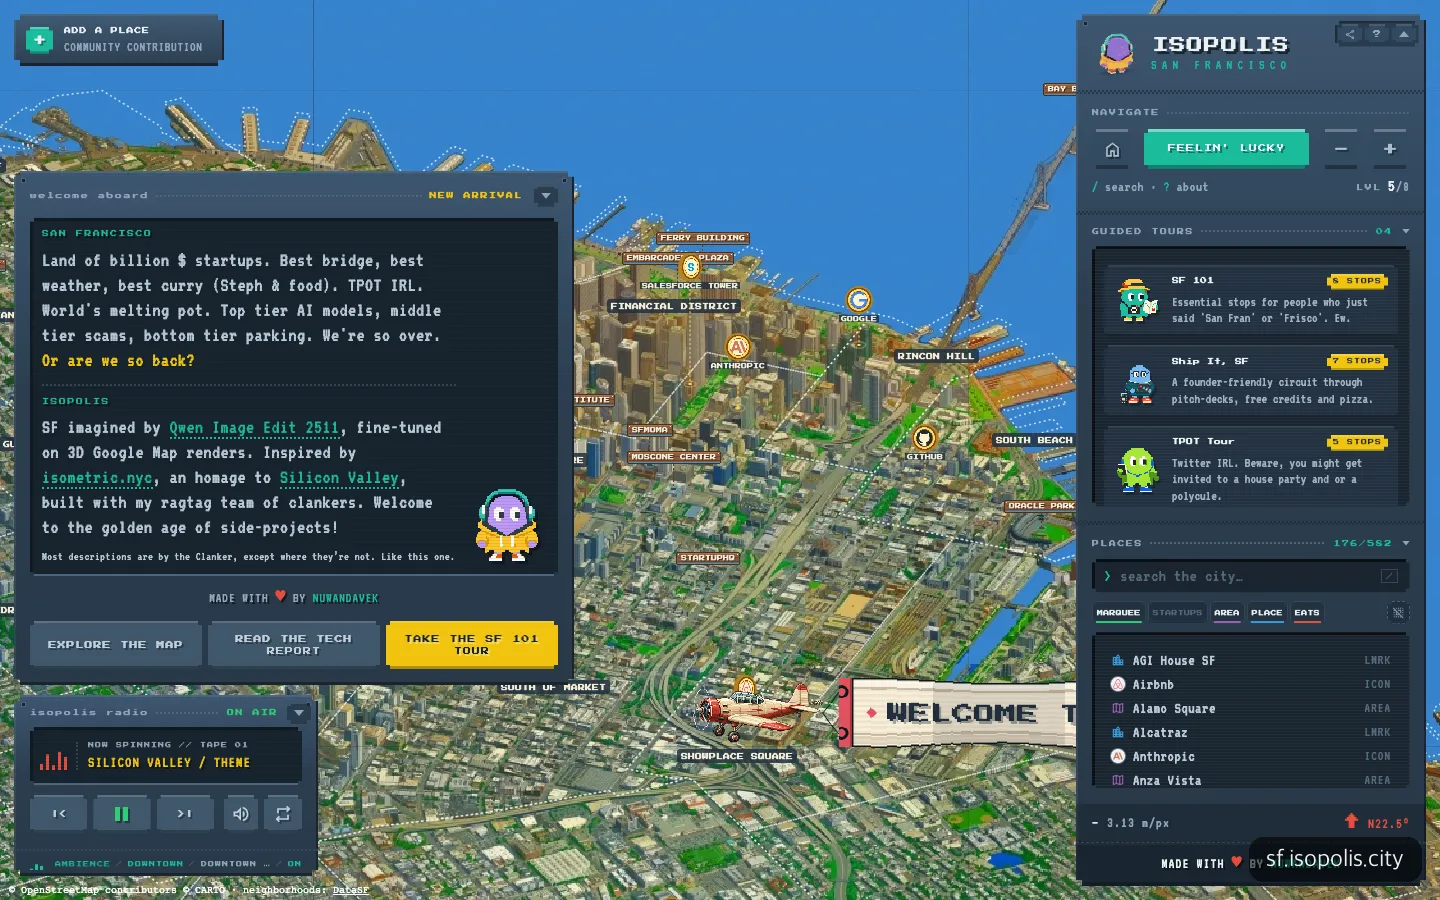
Isopolis, which also draws San Francisco, layers game-like features such as tours, radio, and place collecting on top of the map.
Isopolis goes in the opposite direction. It layers a guided tour, a background music radio, and even a level system that unlocks 582 places one by one on top of the map. It is fun, but the many overlapping windows cover the map itself. If you want to appreciate the artwork itself, Isometric SF is the better fit, because there is almost nothing on screen but the picture.
What Fell Short in Use
First, orientation. The creator rotated the map so the Bay shoreline reads well, which means north is not up. If you are used to map apps, it is confusing at first to tell what is where. The angle is fixed, so you cannot rotate it either.
Second, the zoom limit. I tried to zoom in further on the Golden Gate screen, but the view did not change. It appeared to be at maximum zoom already, which is a letdown for anyone who wants a closer look at a single building. There is also the few-second load when you first open it, and the flat water mentioned earlier stands out when you look at the map broadly.
Can You Make One for Your Own City?
Technically, it is worth trying. The agent wrote most of the code, and thanks to the structure of stepping down to a small model, the cost is at the level of a personal project. The sticking point is the source imagery. Both Isometric SF and NYC captured Google’s 3D map tiles as source material, and Hacker News comments pointed out that such use is probably prohibited under Google Maps API terms.
The Google Map Tiles API policies include an item against “creating content based on Google Maps content,” along with items restricting uses other than visualization, such as image analysis and machine interpretation, and restricting pre-fetching and storing. However, no clause specifically names “redrawing with AI,” and as of Nov. 19, 2026, we could find no statement from Google about this map. It is not yet the stage to declare a violation, but if you follow along with your own city, it makes sense to stop at a noncommercial test and read the terms first. Isometric Cities labeling its maps as either “AI-drawn” or “based on public data (not AI)” is a trace of the same concern.
Frequently Asked Questions
Is Isometric SF free?
Yes. As of November 2026, you can view it right away in a web browser with no sign-up or login, and search and share links are also free.
Can I use the map images?
The tile images are released under CC BY-NC 4.0. You can use them for noncommercial purposes if you credit the source and link to it, and for commercial use you need to ask the creator separately on X.
Can I make a map like this without knowing how to code?
Both people who made SF and NYC said they hardly wrote any code themselves. However, you still have to handle model training, GPU cost management, terabyte-scale storage, and checking the source map’s terms yourself, so testing first on one small neighborhood is the realistic route.
Sources 8
- Show HN: Isometric SF – A pixel-art map of the SF Bay Area (Hacker News)
- isometric sf · the Bay Area in pixel art
- Isometric SF (Justin Chavez 블로그)
- How Isometric SF was made (Justin Chavez 블로그)
- isometric nyc (Andy Coenen)
- 뉴욕시를 거대한 아이소메트릭 픽셀 아트로 표현한 지도 프로젝트 (GeekNews)
- Isometric Cities — Every city, in pixels
- Map Tiles API Policies (Google for Developers)
AI helped with research and the first draft; the operator tried the subject firsthand, checked and edited this article before publishing. Let us know if you spot a mistake.