
One tap on the Central Park button and big text appeared on screen: “In the last 7 days, 254 satellites watched Central Park.” watched.earth is a free website where you enter any place on Earth and see the satellites that passed over it in the past 7 days, plus the real, publicly released satellite photos taken during those passes. Armaan Gupta released it as open source. It was posted to Show HN on Hacker News on November 9, 2026, and as of November 12 it had 480 points and 82 comments.
With numbers that big, there are plenty of questions. Do you really get a photo of your own neighborhood? Why did the developer community react this way? And what is the “looks like AI” argument people kept making in the comments? We take them in order.
How do you use watched.earth?
There is no login. The first screen has a place search box, a “Use my location” button, and example buttons such as Area 51, Central Park, Giza Pyramids, and Surprise me. You can also click the globe to drop a pin.
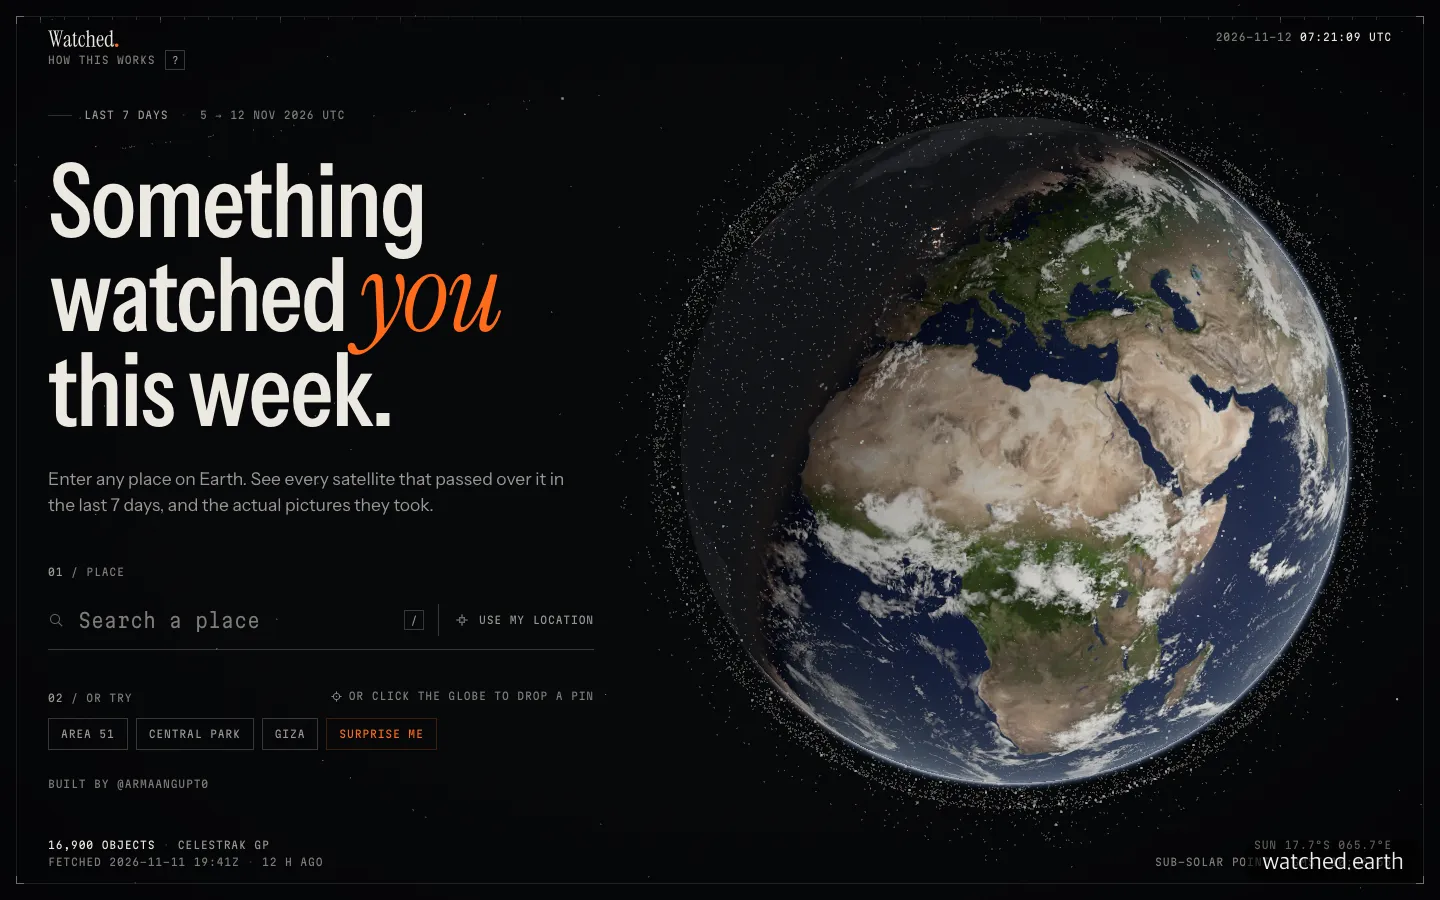
The home screen. Search for a place or tap an example button to jump straight to results.
When we tried it, the first screen took about 4 seconds to load, and results for Central Park appeared within a few seconds of clicking. The coordinates are written right into the address bar, so you can copy the result link and show someone else the same screen. At the bottom, small text reads “16,900 objects” and notes that the orbit data was fetched 12 hours earlier. Status readouts like this give it the feel of a space-agency control screen.
According to the creator’s explanation on Hacker News, it works like this. It takes the roughly 17,000 objects in CelesTrak, a public orbit catalog, and runs them through an orbit calculation method called SGP4 to find which satellites passed over that spot in the last 7 days. It then pulls Sentinel-2, Landsat, and NASA photos taken during those passes from public archives. The calculations run in the browser, and the creator says user locations are not stored.
What “254 satellites watched” really means
The first things you notice on the results screen are the number 254 and “2,046 public images.” But you need to read the four boxes right below to understand that number properly.
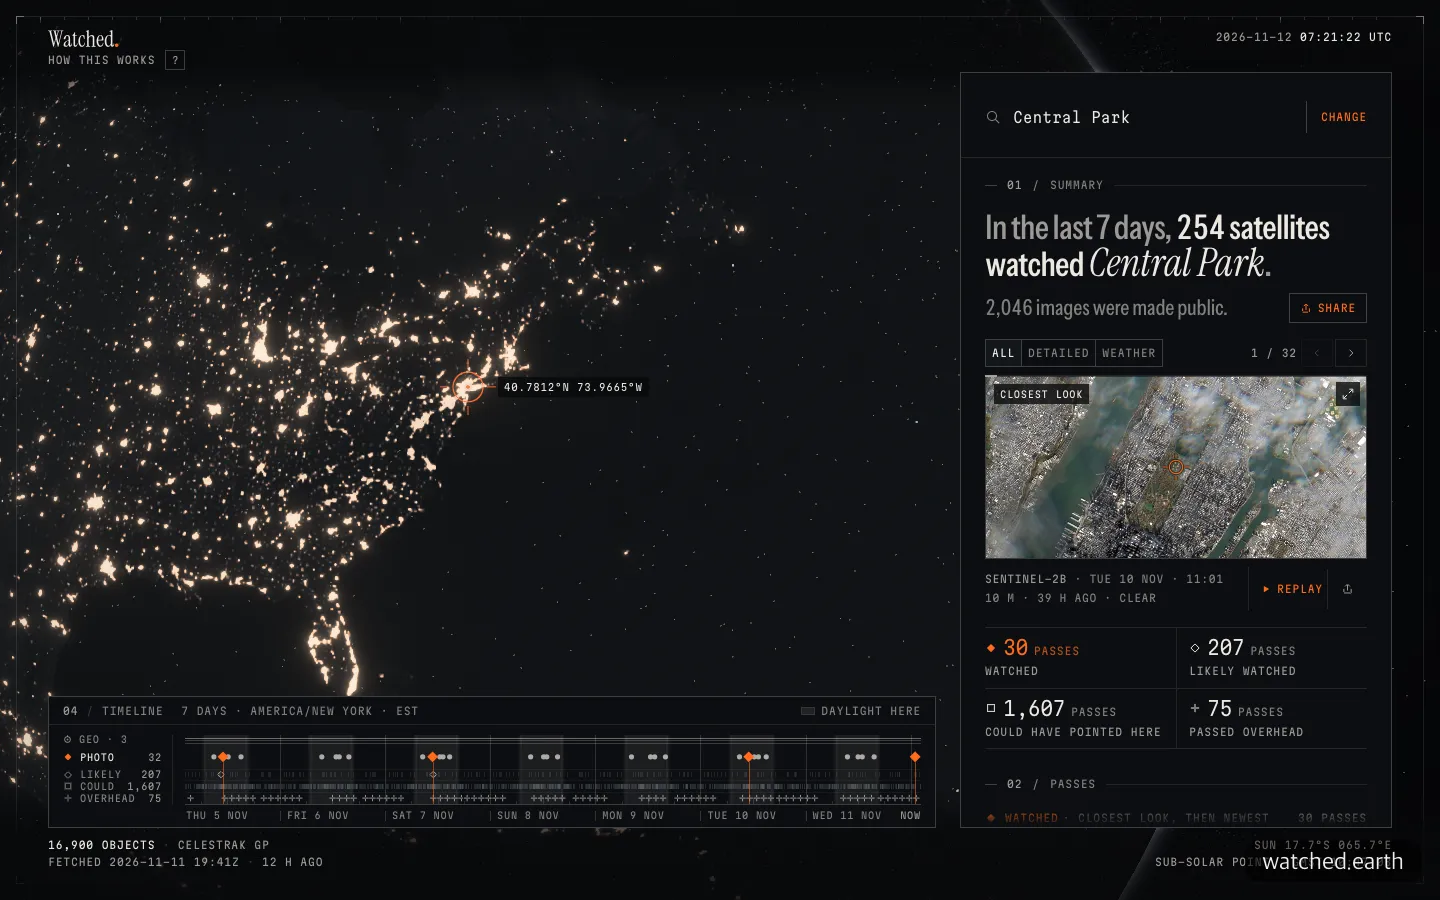
Central Park results. The four boxes under the big headline break down what was actually captured.
| Tier | Meaning | Passes over Central Park |
|---|---|---|
| Watched | A photo exists in a public archive | 30 |
| Likely Watched | Within the camera’s range, but no photo released publicly | 207 |
| Could Have Pointed Here | A commercial satellite could have imaged it, but the operator does not disclose where it shot | 1,607 |
| Passed Overhead | Simply flew over | 75 |
Only 30 passes have an actual photo, and the largest group is “could have pointed here.” The 2,046 images follow a similar pattern. Only 3 were detailed 10 to 30 m photos (Sentinel-2 and Landsat) in which you could recognize a neighborhood. There were 27 daily mosaics (250 to 375 m), and the other 2,016 were full-disk photos of the whole Earth taken by geostationary weather satellites (2 to 5 km). GOES-19, for example, takes one photo every 10 minutes, or 1,008 in a week, but you cannot pick out Central Park in any of them.
There is a reason detailed photos are scarce. According to Copernicus materials, Sentinel-2 runs as a pair of satellites and revisits major land areas every 5 days. That means it passes once or twice in a week, and if clouds are in the way that day, the photo is unusable. The results did show passes marked as unusable because of 80% or 100% cloud cover, and we appreciated that the site states this openly rather than hiding it.
The closest photo was a 10 m resolution image taken by Sentinel-2B at 11:01 a.m. Eastern Time on November 10. You can see Manhattan’s terrain and Central Park’s greenery, but it is hard to make out individual buildings. The creator also replied in the Hacker News comments that for most of the world, about 10 m/px is the best public imagery available.
Why Hacker News responded
Start with what the sources say: this service did not create new data. Orbits come from CelesTrak, and photos come from public sources such as Microsoft Planetary Computer, Element 84 Earth Search, NASA GIBS, EUMETSAT, and Copernicus (per the repository README).
So why 480 points? EasyTicket’s judgment after trying it is that the answer lies more in presentation than in technology. Three things work together.
First, the line “Something watched you this week.” It turns a satellite pass calculation into the feeling of “someone saw me.” Second, instead of laying data out in a table, it replays the moment. Third, results can be shared as a single link, so it spreads easily as “try it for your neighborhood too.”
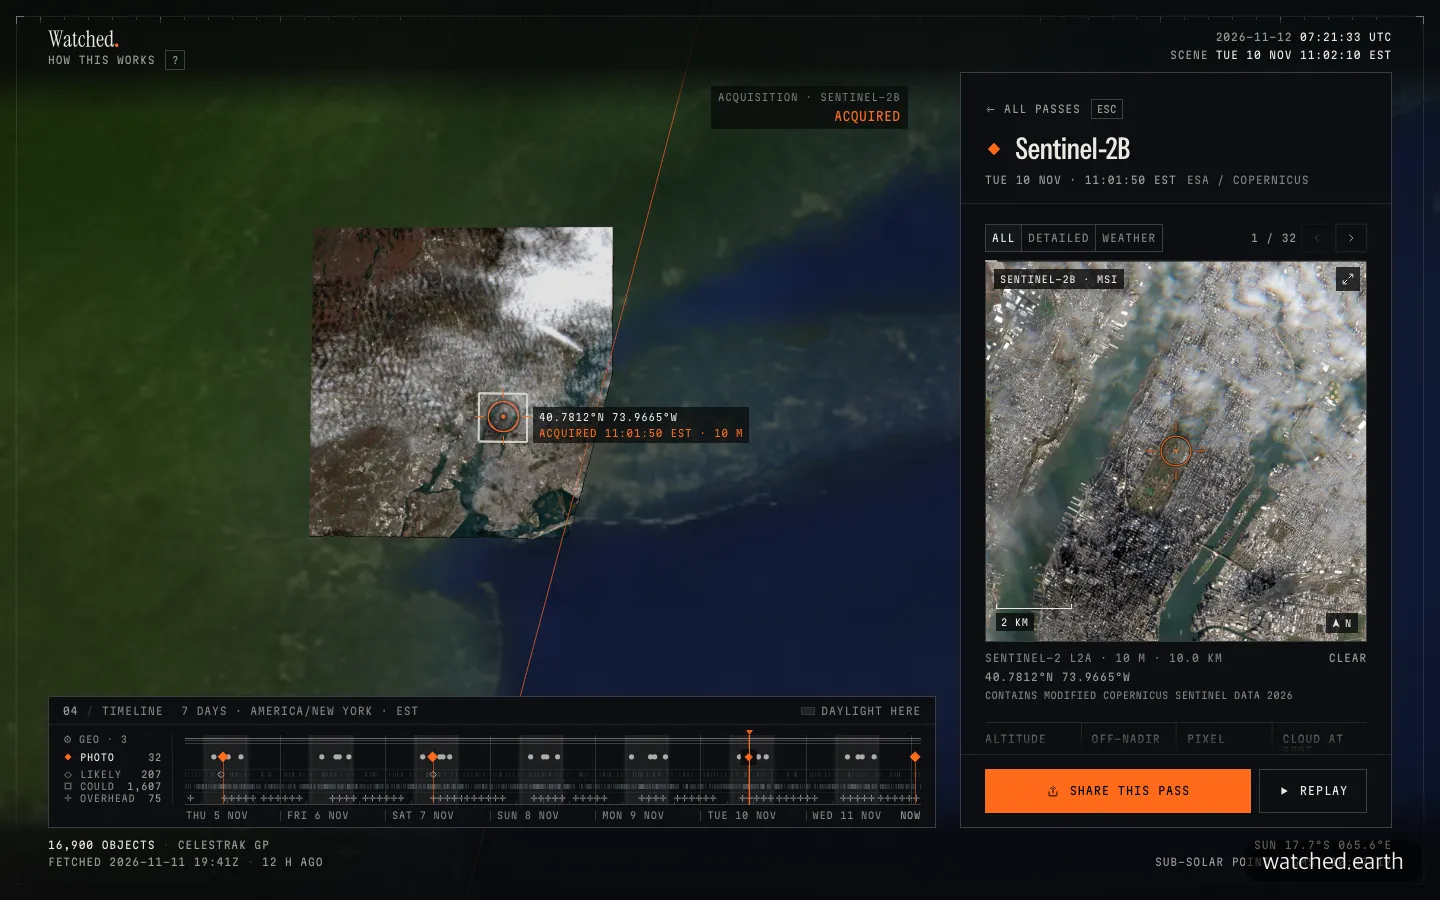
Replay of the capture moment. The track line passes, the capture zone settles into place, and the real 10 m photo appears.
When you press the Replay button, the satellite’s track line sweeps across the map, a capture-zone rectangle drops into place, “ACQUIRED 11:01:50 EST” is stamped, and the real photo appears on the right. It is not live surveillance but a replay of something that already happened, yet the same photo feels far more vivid this way. This was the scene that stayed with us longest.
Traces of Claude and the “looks like AI” debate
The public repository contains a file called CLAUDE.md, a Claude Code working instructions file. It specifies that in commit history the owner is recorded as the author and Claude as the committer, and the contributor list shows Claude and Armaan Gupta side by side. It is built with TypeScript, React 19, and three.js, under the MIT license. As of November 12, it had 126 stars and 234 commits.
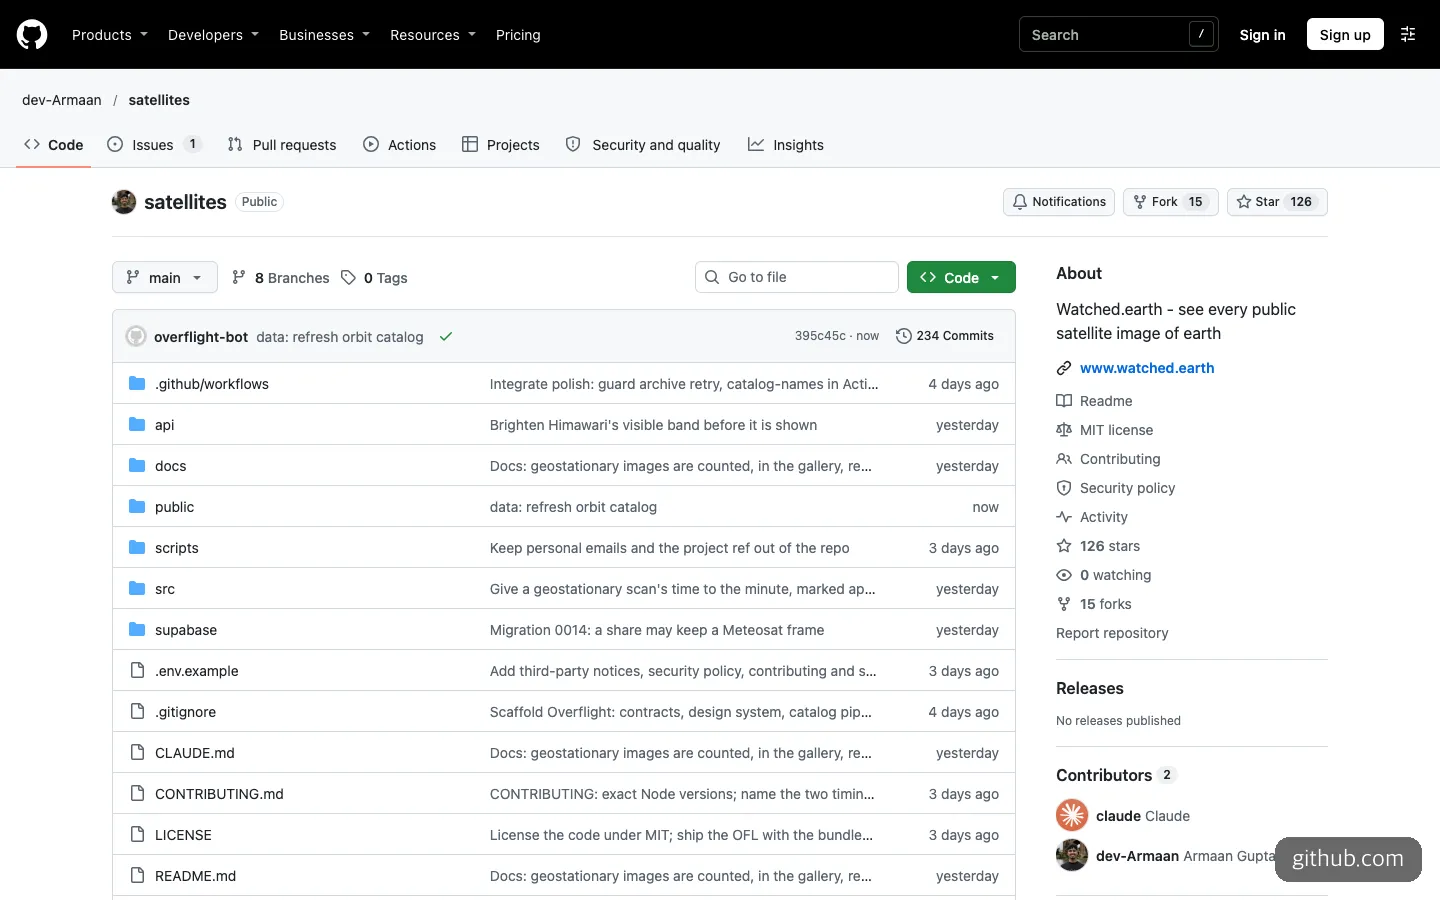
The public repository. The CLAUDE.md file and Claude in the contributor list are the traces of its being built with Claude Code.
The claim that it was “built in three days,” however, comes from commenters, and the creator has not confirmed it.
In the Hacker News discussion, the most comments gathered around the “AI-looking UI.” The font, the orange period at the end of the logo, the blinking square icon, and the logo’s letter spacing were cited as the “tells.” Looking at the screen, you do find a black background with orange accents, small uppercase monospaced labels, and serif italic headings. On the other hand, many comments praised the design and polish. A Hacker News moderator said the intro text seemed to be written by AI and asked for a version the creator wrote personally, and did not get a reply. Even so, the moderator called it creative work, moved the post back up, and asked people not to make personal attacks.
EasyTicket’s view is this. It is true that the look resembles a style AI often produces these days, but the polish, including the information hierarchy and timeline, is high, and that is no reason to discount the usefulness of the result. If anything, anyone planning to ship something with vibe coding has something to learn here: even with public data everyone uses, a “one-sentence concept” and a “single staged scene” will get people to come in and look.
How it differs from similar services
A few services tackle the same question (which satellites are passing over me). Comparing them within what we tried:
| watched.earth | Orbital Radar Satellite Eye | SpyMeSat | |
|---|---|---|---|
| Nature | Replay of the past 7 days of passes and public photos | List of imaging-satellite passes and a surveillance score (A to F) | Pass alert app and a marketplace for buying satellite photos |
| Photos | Public photos from Sentinel-2, Landsat, weather satellites, and more | Sentinel-2 (10 m), NASA GIBS, Landsat | Photos you pay for, and new imaging orders |
| Where to use | Web | Web | Web app, iOS and Android apps |
| How far we tried it | Through results and replay | First screen and guide only | First screen only |
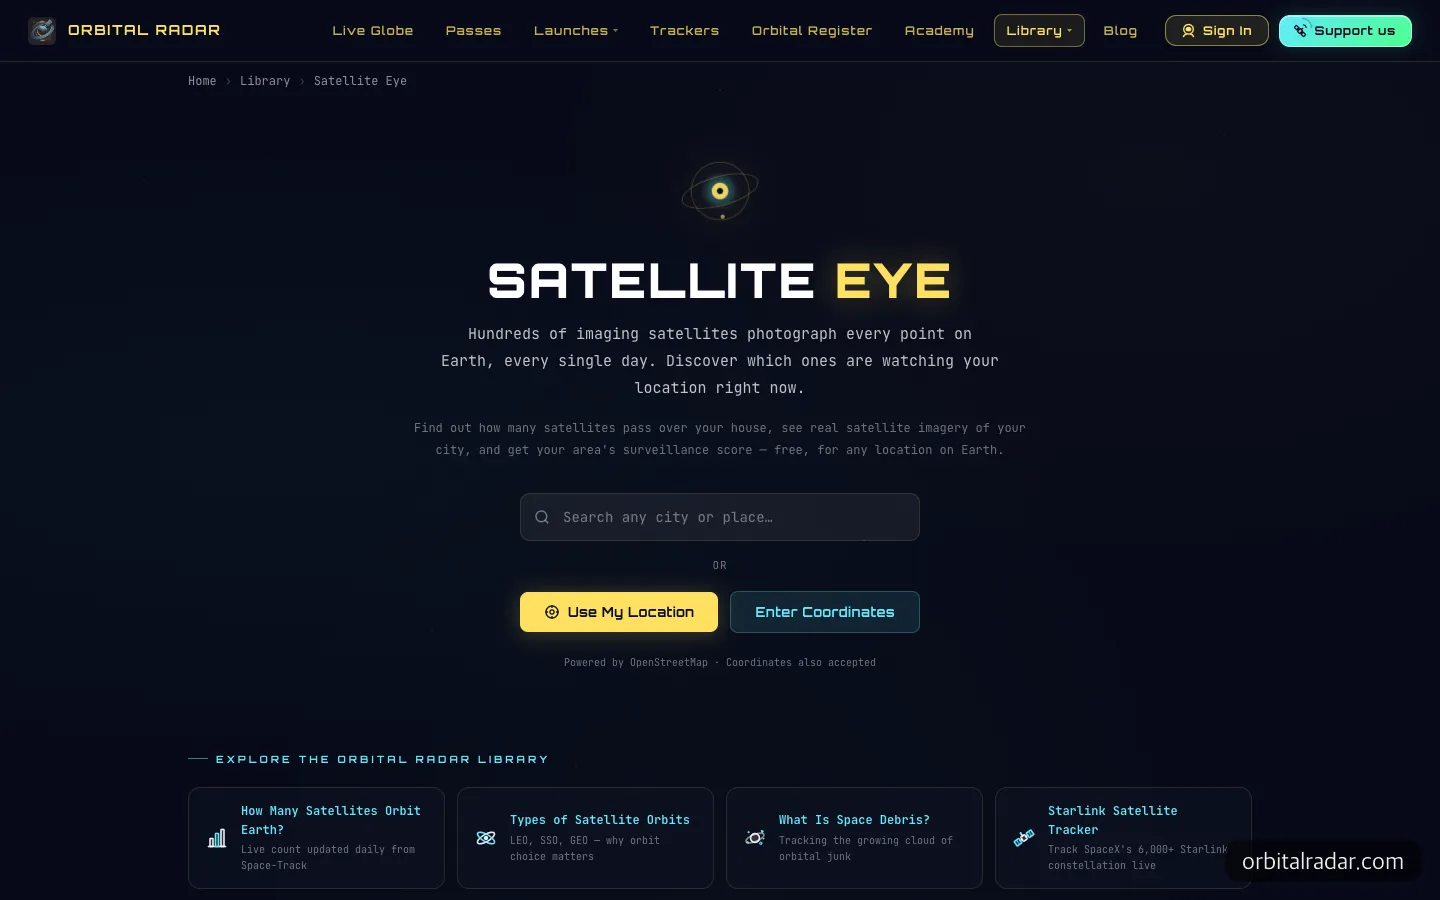
The home screen of Orbital Radar’s Satellite Eye, the closest free service.
Orbital Radar describes itself as “free, anywhere on Earth,” and in the “most imaged places” table lower on the page it gives Seoul a D grade (80 or more). This time we did not see search results, so we could not confirm whether that score is calculated per location or is a general estimate. We also could not confirm which service came first.

SpyMeSat puts its satellite photo marketplace ahead of pass alerts.
SpyMeSat is a different kind of service. Its first-screen copy is “the easiest way to buy satellite photos.” If you truly need a photo of your home sharper than 10 m, you have to go to a paid service like this, and if you just want to take a look for fun, watched.earth is the right fit.
What disappointed us
The biggest letdown is the distance between the headline and reality. “254 satellites watched” sounds strong, but most are in the “could have pointed here” tier. Commercial radar satellites like Capella-14, which ranked near the top of that tier, passed 26 times in the past 7 days and came as close as 9 km, but the operator does not disclose whether it imaged anything. The label descriptions do state this limit themselves, but someone who closes the screen after the first sentence can easily come away misled.
The other limits point the same way. Military and reconnaissance satellites are not tracked, photos take hours to days to reach the archive, and at 10 m resolution you cannot see people. One Hacker News user who said they had worked on satellite ground processing countered that real systems query archives directly and that satellites can image obliquely even when not directly overhead.
Language is another hurdle for Korean readers. The screen and all text are in English, and we did not get to try Korean place names such as Seoul this time. When looking up your own neighborhood, using an English place name or pressing “Use my location” is probably the safer route. The results panel is also long, so you have to scroll quite far to see all of it, a minor inconvenience.
Frequently asked questions
Is watched.earth free?
Within what we tried, results appeared immediately with no login and no payment screen. The code is also public under the MIT license.
Is it okay to enter my location?
In his Hacker News explanation, the creator says orbit calculations run in the browser and user locations are not stored. If you are worried, entering a neighborhood name or a nearby park instead of your home address gives nearly the same results.
Do military satellites show up?
No. It uses only public orbit catalogs and public photos, so military and reconnaissance satellites do not appear.
Could I build something like this?
All the data comes from public sources, and the repository even publishes the Claude Code working instructions. It is a good textbook for reading through the structure.
For anyone hoping to confirm that a satellite captured their neighborhood in sharp detail, watched.earth will be a letdown. If you want to know what kind of scene turns a line of public data into something people come to look at, we recommend starting by pressing Replay on the Central Park result.
Sources 6
AI helped with research and the first draft; the operator tried the subject firsthand, checked and edited this article before publishing. Let us know if you spot a mistake.